Additional Resources
This chapter provides curated resources to help you get the most out of NULISAseq data analysis, including package documentation, R programming tutorials, visualization tools, and technical references.
NULISAseq Resources
Package Documentation
The NULISAseqR package includes comprehensive documentation accessible directly from R:
# Overall package documentation
?NULISAseqR

# Function-specific help
?importNULISAseq   # Data import
?lmNULISAseq       # Linear modeling
?lmerNULISAseq     # Linear mixed effect modeling
?lmNULISAseq_pred  # Predictive modeling with lm
?glmNULISAseq      # Generalized linear modeling
?generate_heatmap  # Heatmap visualization
?generate_pca      # PCA visualization
?volcanoPlot       # Volcano plot visualization
?render_QC_report  # QC report generation
GitHub Repository
The GitHub repository includes:
- Latest package source code
- Example datasets and workflows
- Issue tracker for bug reports and feature requests
Support and Issues
- Report bugs: GitHub Issues
- Request features: Open an issue on GitHub with the “enhancement” label
- Ask questions: Use GitHub Discussions or contact Alamar Biosciences support
NULISA Analysis Software (NAS)
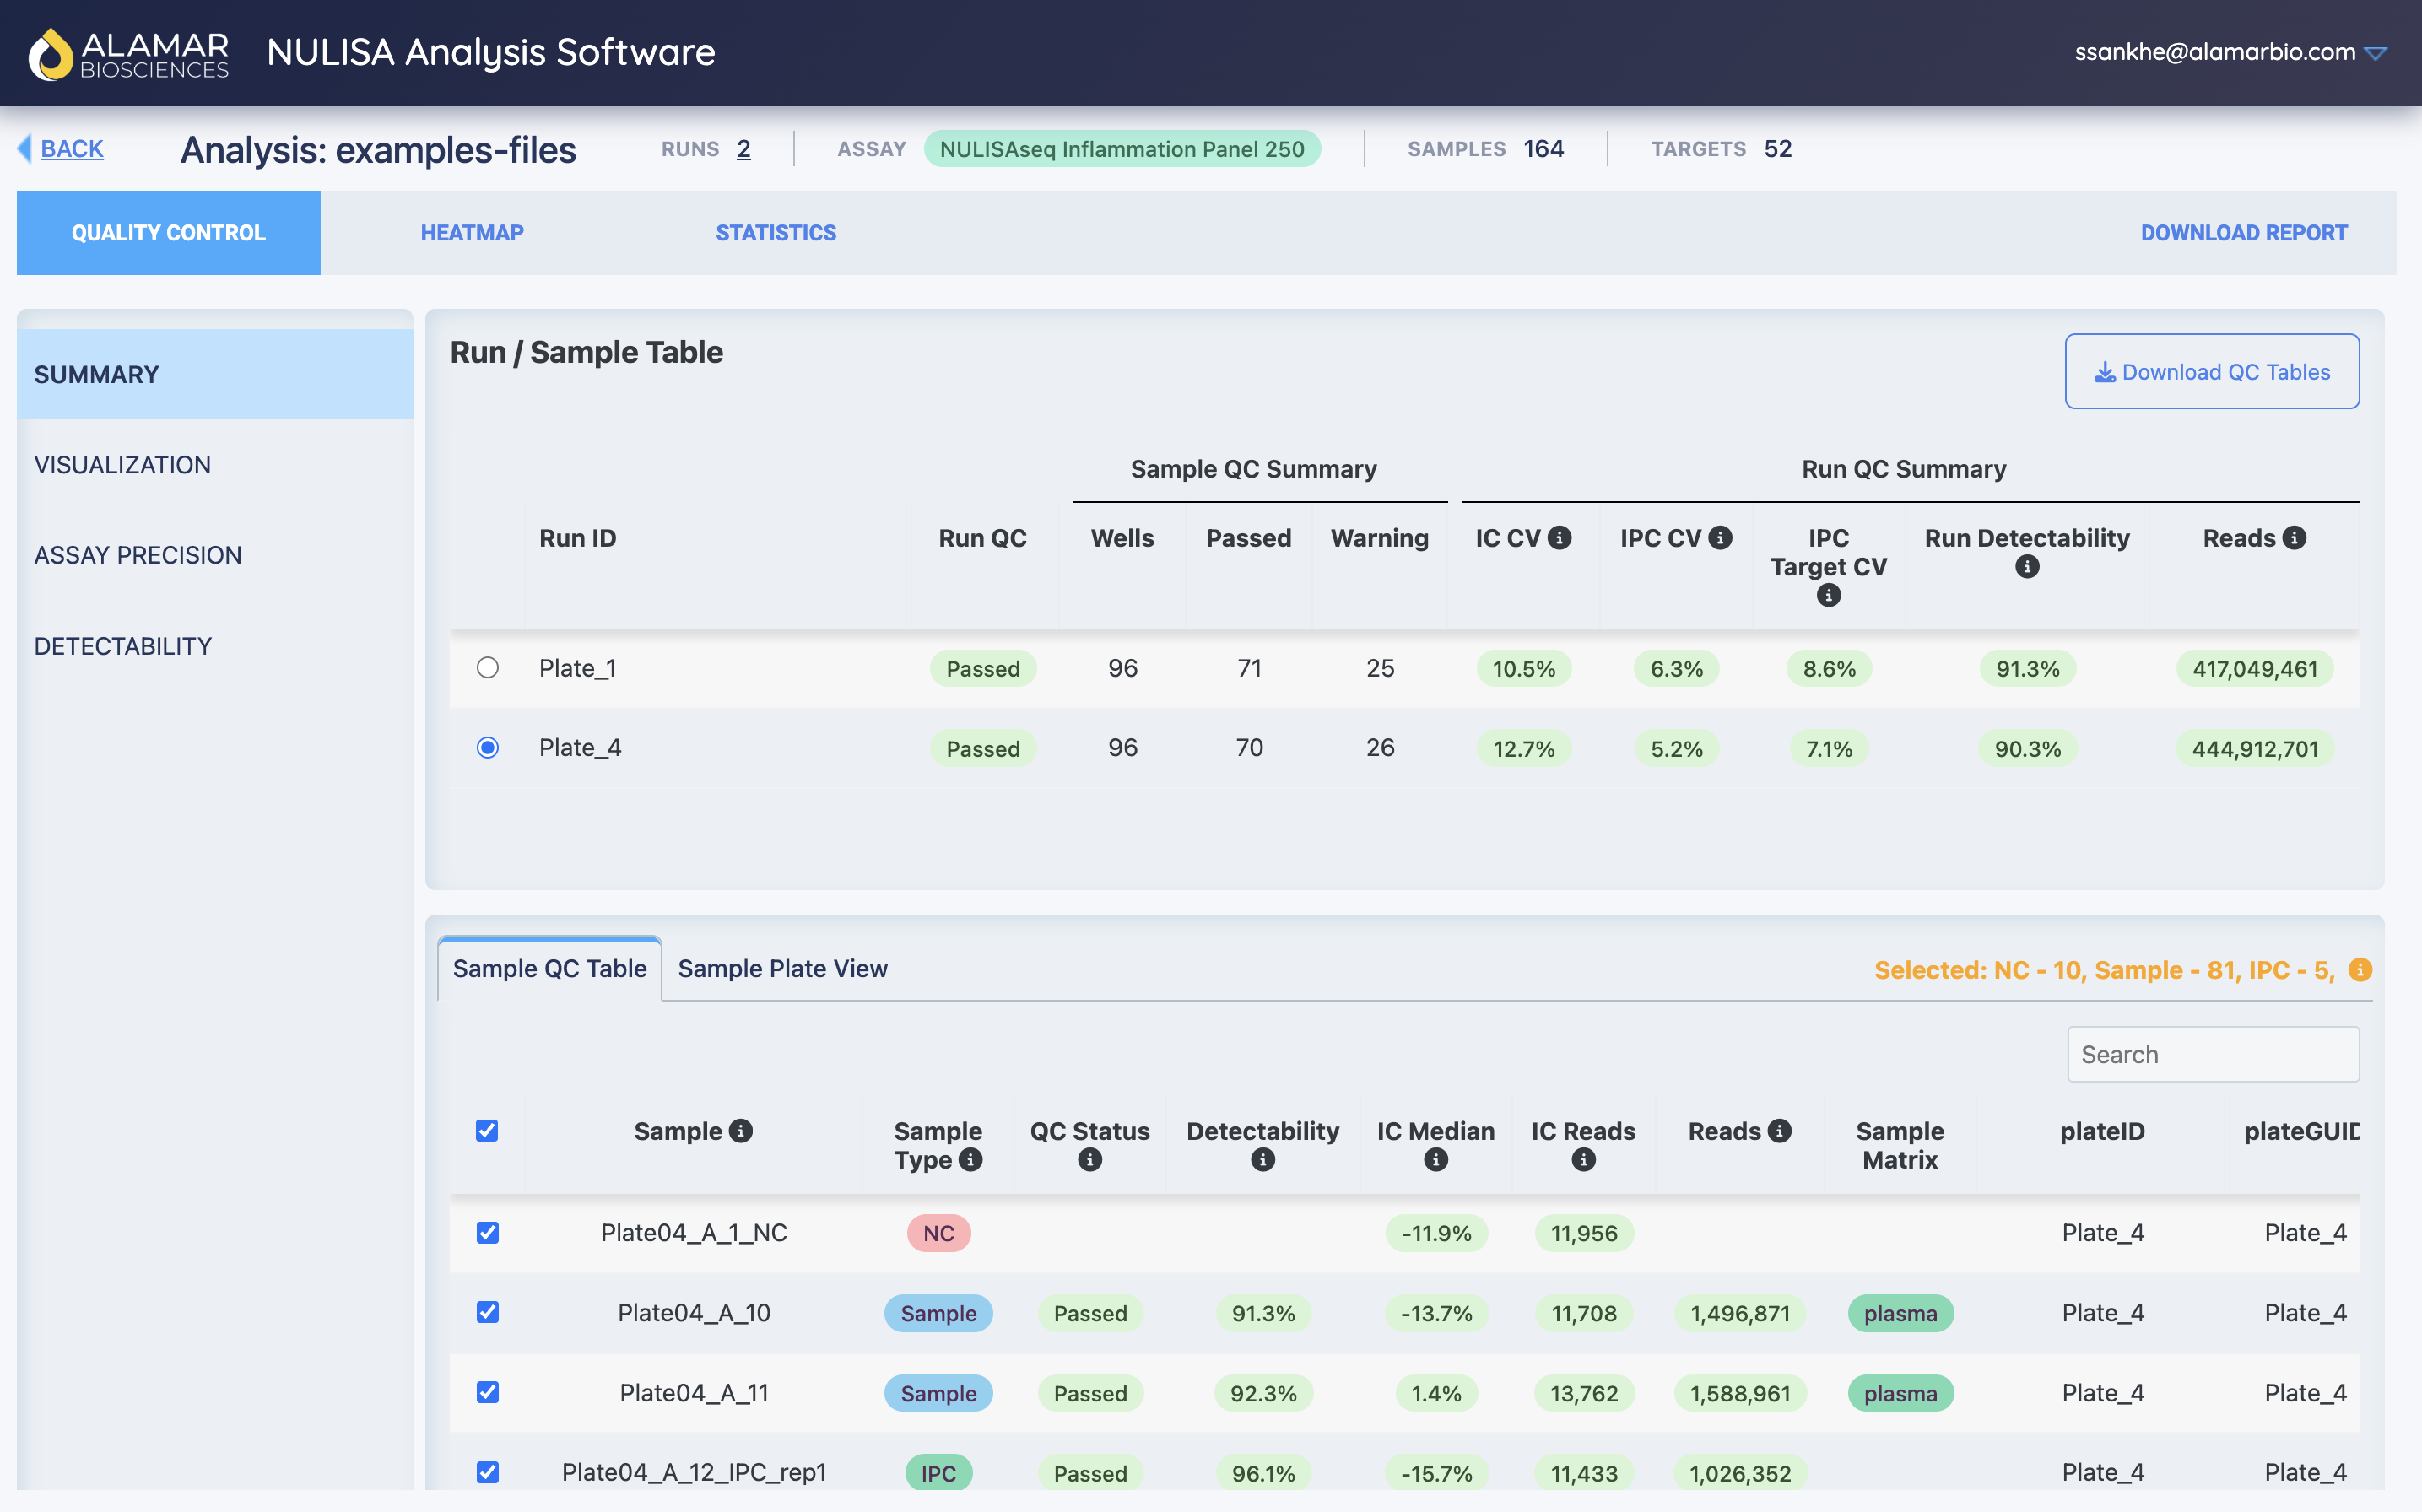
NULISA Analysis Software (NAS) is Alamar Biosciences’ proprietary web-based platform for processing and analyzing NULISAseq data.
NAS provides an intuitive interface for:
- Automated data processing: XML data file to normalized protein quantification or absolute quantification
- Quality control: Comprehensive QC metrics and visualization
- Interactive analysis: Real-time exploration of protein expression data
- Report generation: Automated QC and analysis reports
- Data export: Download processed data in various format
NAS streamlines the initial data processing workflow, allowing researchers to quickly assess data quality and obtain normalized protein quantities (NPQ) before performing statistical analysis.
Web Platform: NULISA Analysis Software (NAS)
NAS Overview Video: NULISA Analysis Software (NAS) Training
Access Required: Contact Alamar Biosciences support team to request an account
Support: For NAS technical support or questions, contact Alamar Biosciences support
Technical Documentation
NULISAseq Technology Technical Notes
Information Sheet - NULISAseqTM Lot and Batch Definitions
Definitions of lot and batch structures, validation data, and experimental design considerations for NULISAseq assaysTech Note - Performing relative quantitation of high-plex NULISAseq data
NULISA data normalization, NPQ calculations, and statistical approaches used for relative quantification in multiplex NULISAseqTM assaysTech Note - NULISATM multiplex normalization & quality control
NPQ calculation steps, plate-level quality control metrics and additional normalization strategies for NULISAseqTM multiplex assaysTech Note - Capturing 12 logs dynamic range using NULISAseq
Describes the assay tuning method incorporated by Alamar into NULISAseqTM panels to achieve broad dynamic rangeTech Note - Determining the Absolute Concentration of High-Plex NULISAseq Protein Targets
Calibration methodology, sample processing steps, and validation results for absolute quantification analysis using the NULISAseqTM Inflammation Panel AQ
R Programming Resources
Installing R and RStudio
Required Software:
- R (the language): Download from CRAN
- Windows: Direct link
- macOS: Direct link
- Linux: Instructions
- RStudio (the IDE): Download from Posit
Installation Order: Install R first, then RStudio.
R and RStudio Resources and Tutorials
R for Data Science by Hadley Wickham and Garrett Grolemund
- Comprehensive introduction to the tidyverse
- Data import, wrangling, visualization, and modeling
- Free online book with exercises
Hands-On Programming with R by Garrett Grolemund
- Beginner-friendly introduction to R programming
- Learn by building R projects
- Covers R basics, data structures, and functions
- Curated learning resources
- Cheat sheets for R packages
- Interactive tutorials
Tidyverse Resources
The tidyverse is essential for data manipulation and analysis in this book:
- Package documentation
- Learning resources
- Blog with tips and updates
- Data manipulation verbs
- Working with grouped data
- Joining datasets
- Reshaping data (pivot_longer, pivot_wider)
- Handling missing values
- Nesting and unnesting data
Data Visualization Resources
ggplot2
ggplot2 is the primary visualization package used throughout this book.
ggplot2 Official Documentation
- Complete reference for all geoms and functions
- Articles on faceting, scales, themes, and extensions
ggplot2: Elegant Graphics for Data Analysis by Hadley Wickham
- Comprehensive guide to ggplot2
- Theory and practice of the grammar of graphics
- Advanced customization techniques
R Graphics Cookbook by Winston Chang
- Recipe-style solutions for common plotting tasks
- Quick reference for plot types and customizations
- Showcase of ggplot2 extension packages
- Specialized plot types and themes
ComplexHeatmap
ComplexHeatmap is a powerful package for creating sophisticated heatmaps, extensively used in proteomics visualization.
ComplexHeatmap Complete Reference
- Comprehensive guide to all features
- Examples for every visualization type
- Advanced customization options
ComplexHeatmap Bioconductor Page
- Installation instructions
- Official documentation
- Vignettes and examples
PCAtools
PCAtools provides enhanced PCA visualization and analysis capabilities.
PCAtools
NULISAseq-specific features
Alamar Biosciences fork of PCAtools by Kevin Blighe and Aaron Lun.
Version compatible with NULISAseq-specific features and workflows.
View on GitHub
- Comprehensive PCA analysis functions
- Scree plots, biplots, and loading plots
- Statistical tests for optimal PC selection
Citing This Book and Packages
Citing This Book
Alamar Biosciences Bioinformatics Team. (2025). NULISAseq Data Analysis Guide.
Alamar Biosciences. Available at: https://vignettes.nulisaseqr.alamarbio.comKey Citations
NULISAseq Platform and Tools
NULISAseqR Package: Alamar Biosciences. (2025). NULISAseqR: Analysis Tools for NULISAseq Proteomic Data. R package. https://github.com/Alamar-Biosciences/NULISAseqR
R Statistical Software: R Core Team (2024). R: A language and environment for statistical computing. R Foundation for Statistical Computing, Vienna, Austria. https://www.R-project.org/
Alamar Biosicences: Alamar Biosciences. (2025). NULISA Platform and Proteomic Solutions. https://alamarbio.com/
Nature Communication aritcle on NULISAseq Technology: Feng, W., Beer, J.C., Hao, Q. et al. NULISA: a proteomic liquid biopsy platform with attomolar sensitivity and high multiplexing. Nat Commun 14, 7238 (2023). https://doi.org/10.1038/s41467-023-42834-x
NULISATM Platform Video: Alamar Biosciences (2023). The NULISA™ Platform by Alamar Biosciences. YouTube. https://www.youtube.com/watch?v=24nVyCoJv4w
NULISA Analysis Software Training Video: Alamar Biosciences (2023). The NULISA Analysis Software (NAS) Training by Alamar Biosciences. YouTube. https://www.youtube.com/watch?v=sS8oB8suRBk
R and Packages
R Statistical Software: R Core Team (2024). R: A language and environment for statistical computing. R Foundation for Statistical Computing, Vienna, Austria. https://www.R-project.org/
tidyverse: Wickham H, Averick M, Bryan J, Chang W, McGowan LD, François R, Grolemund G, Hayes A, Henry L, Hester J, Kuhn M, Pedersen TL, Miller E, Bache SM, Müller K, Ooms J, Robinson D, Seidel DP, Spinu V, Takahashi K, Vaughan D, Wilke C, Woo K, Yutani H (2019). “Welcome to the tidyverse.” Journal of Open Source Software, 4(43), 1686. https://doi.org/10.21105/joss.01686
bookdown: Xie, Y. (2016). bookdown: Authoring Books and Technical Documents with R Markdown. Chapman and Hall/CRC. ISBN 978-1138700109. https://bookdown.org/yihui/bookdown/
ggplot2: Wickham, H. (2016). ggplot2: Elegant Graphics for Data Analysis. Springer-Verlag New York.
ComplexHeatmap: Gu, Z., Eils, R., Schlesner, M. (2016). “Complex heatmaps reveal patterns and correlations in multidimensional genomic data.” Bioinformatics 32(18), 2847-2849.
PCAtools: Blighe, K., Lun, A. (2022). PCAtools: Everything Principal Components Analysis. https://github.com/kevinblighe/PCAtools
Happy analyzing! 🚀
We hope this book and these resources help you gain meaningful insights from your NULISAseq data. If you have questions or feedback, please reach out through the GitHub repository or contact Alamar Biosciences support at support@alamarbio.com.